
How many languages do you use to communicate?
A new analysis from Start.io finds that roughly 9 percent of people in America communicate using two or more languages. Linguistically diverse communities are the biggest in New Jersey, Florida, California, New York, and Texas, while they’re the smallest in West Virginia, Montana, North Dakota, Vermont, and Maine.
Start.io recently analyzed a fully anonymized sample of 94.7 million smartphones and tablets in the United States, querying how many keyboard languages were installed on each device. Nine out of 10 mobile devices in the U.S. have just one keyboard language, while the rest have two or more keyboards.
Start.io’s analysis examined keyboard installation rates, but not how often each keyboard was used.
This analysis provides an alternative look at language use in the United States, because it captures a practical view of the tools people use to communicate with their friends, family members, and at work.
In this article, we’ll highlight the most thought-provoking insights from this analysis. Contact us for more information about this dataset, and Start.io’s other data capabilities.
What are the most popular languages in America?
No surprise, English is the most popular language in use in the United States. Of the 94.7 million mobile devices owned by people in this study, 91 percent are monolingual—they use just one keyboard when typing on their smartphone or tablet. Among people who are monolingual, roughly 87.6 percent communicate exclusively in English.
The 5 most popular languages in the United States among monolingual communicators:
| 1 | English | 87.6% |
| 2 | Spanish | 7.2% |
| 3 | Chinese (Mandarin and Cantonese) | 0.9% |
| 4 | Japanese | 0.6% |
| 5 | Korean | 0.6% |
| All other monolingual communicators | 3% |
Roughly 5.7 percent of people in the United States are bilingual—they use two keyboards when texting. The remaining 3.1 percent of people use three or more mobile keyboards.
The 5 most popular bilingual keyboard combinations in the United States:
| 1 | English + Spanish | 63.7% |
| 2 | English + Chinese (Mandarin and Cantonese) | 6.2% |
| 3 | English + Arabic | 4% |
| 4 | English + Japanese | 3.8% |
| 5 | English + Korean | 3.2% |
| English + all other languages | 19% |
Which U.S. states have the least language diversity?
West Virginia, Montana, North Dakota, Vermont, and Maine are the five states with the least language diversity, with the highest concentration of English communicators in the nation.
The 5 states with the highest concentration of English communicators, per capita:
| 1 | West Virginia | 99.4% |
| 2 | Montana | 99.4% |
| 3 | North Dakota | 99.2% |
| 4 | Vermont | 99.2% |
| 5 | Maine | 99.1% |
| National average | 96.1% |
Which U.S. states have the most language diversity?
The five most linguistically diverse states in 2024 are New Jersey, Florida, California, New York, and Texas. These states have the lowest percentage of English communicators in the nation, per capita.
The 5 states with the lowest concentration of English communicators, per capita:
| 1 | New Jersey | 91.9% |
| 2 | Florida | 93% |
| 3 | California | 93.1% |
| 4 | New York | 93.5% |
| 5 | Texas | 93.8% |
| National average | 96.1% |
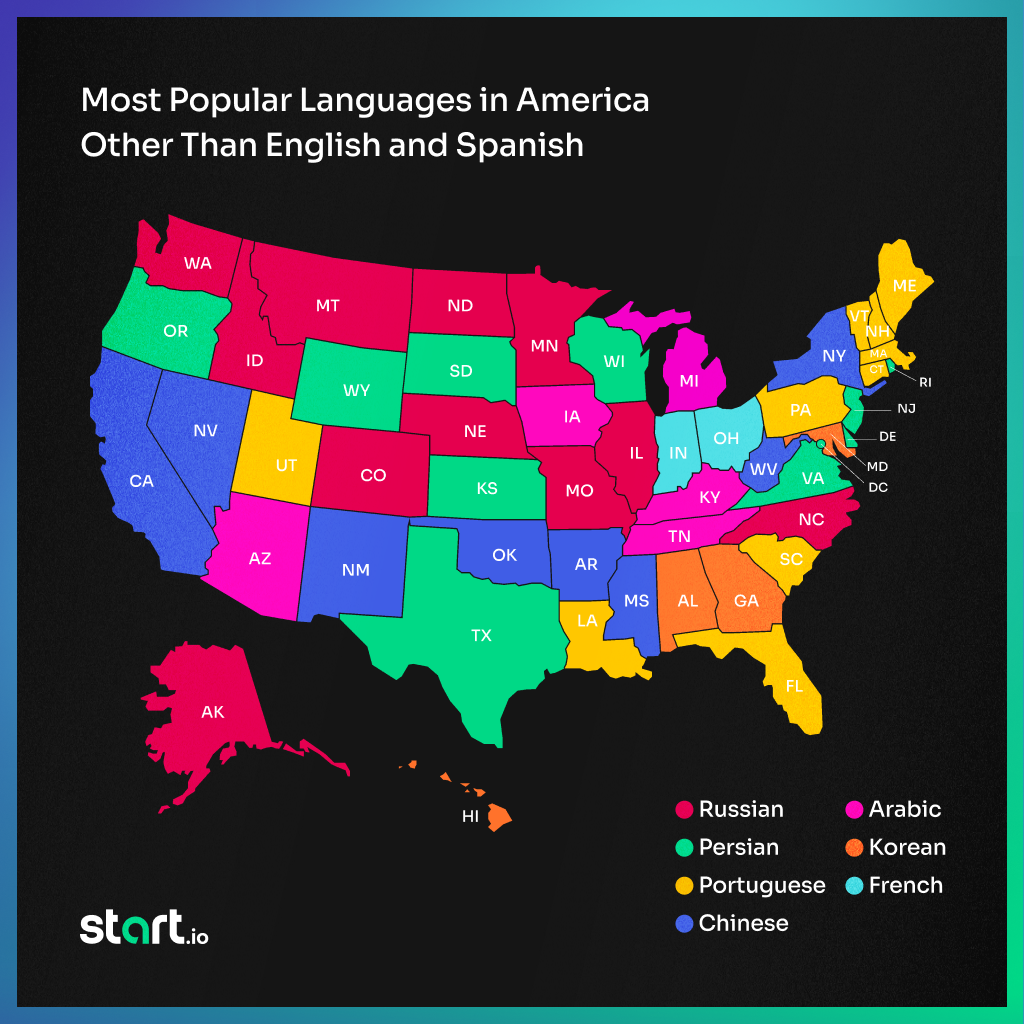
What is the most popular language other than English and Spanish in each state?
English is the most popular language in all 50 states, followed by Spanish. Russian is the most popular language (other than English and Spanish) in 11 states, Persian and Portuguese are the most popular languages in 10 states each, followed by Chinese (8 states), Arabic (5 states), Korean (4 states) and French (2 states).
The #3 most popular language in all 50 U.S. States (other than English and Spanish):
| Russian | Alaska, Colorado, Idaho, Illinois, Minnesota, Missouri, Montana, Nebraska, North Carolina, North Dakota, Washington |
| Persian | Delaware, Kansas, New Jersey, Oregon, Rhode Island, South Dakota, Texas, Virginia, Wisconsin, Wyoming |
| Portuguese | Connecticut, Florida, Louisiana, Maine, Massachusetts, New Hampshire, Pennsylvania, South Carolina, Utah, Vermont |
| Chinese (Mandarin and Cantonese) | Arkansas, California, Mississippi, Nevada, New Mexico, New York, Oklahoma, West Virginia |
| Arabic | Arizona, Iowa, Kentucky, Michigan, Tennessee |
| Korean | Alabama, Georgia, Hawaii, Maryland |
| French | Indiana, Ohio |
Where are there statistically significant concentrations of non-English speakers in America?
Certain states have a greater-than-average concentration of non-English and bilingual communicators.
For example, Massachusetts is home to nearly 10 times as many Portuguese speakers than the national average. The state has a long history of Portuguese immigration, stretching back to the whaling industry of the 1800s.
Greater-than-average concentrations of non-English speakers in America:
| State | Greater than the national average: |
| Portuguese speakers in Massachusetts | 9.8x |
| Serbian speakers in Alaska | 7x |
| Polish speakers in Illinois | 6.6x |
| Persian speakers in Kansas | 5.1x |
| Central Khmer speakers in Massachusetts | 5x |
| Gujarati speakers in New Jersey | 5x |
| Central Khmer speakers in Rhode Island | 4.7x |
| Burmese speakers in Nevada | 4.5x |
| Hebrew speakers in New York | 4.5x |
| Polish speakers in Connecticut | 4.4x |
| Thai speakers in Alaska | 4.2x |
| Ukrainian speakers in Washington state | 4.2x |
| Persian speakers in Delaware | 4.2x |
Methodology
Start.io delivers hundreds of millions of digital ads per day and collects anonymized data where it’s permitted by privacy regulations. Some mobile devices share their keyboard language with advertisers, who use this data to build targeted ad campaigns.
In May 2024, Start.io studied 94.7 million mobile devices in use in the United States, and analyzed which keyboard or keyboards those devices had installed. Start.io analysts studied keyboard installation rates, but not keyboard usage or volume.
Contact us for more information about this data set, and Start.io’s other data capabilities.